
14 min read
Up-to-date KPIs Metrics for Software Development

Introduction
When it comes to software development, measuring and tracking performance is crucial for success. According to McKinsey, the top 25% of software development companies outperform the bottom 25% by up to 5 times in terms of performance, once the average difference is about 2x. So, how can you ensure that your development team is on the right track?
One effective way to measure performance is through KPIs (key performance indicators). But what’s the difference between the two, and how can you use them to achieve success? Understanding the KPIs for software development can help you make informed decisions and drive success.
In this article, we’ll define what are KPI; highlight important KPI metrics specific to software development; provide desirable or acceptable values for some software development KPIs. We’ll also discuss how to choose, collect, and analyze KPI metrics to achieve success.
What are KPIs and Metrics for Software Development?
In terms of software development, metrics are variables that enable managers to quantify and track various aspects of their software development teams. These variables offer insights into how well development activities are performing and can be used to measure the success or failure of your team in common or a specific role in particular.
Along with that, key performance indicators are quantifiable measures used to evaluate the performance, efficiency, and effectiveness of software development processes within a software development organization.
KPIs and metrics are related concepts but surely not the same. Simply put, KPIs are a subset of metrics. In other words, every KPI is a metric but not every metric is KPI.
Typical Metrics for Software Development With Examples
Once we’ve understood the difference between these two entities, let’s drill down and find out which typical metrics can be applied to the software development process. We’ve divided them into groups for your better understanding.
Agile Metrics
This group of software development metrics can be applied to Agile teams only:
- Open/Close rate. This metric is an indicator of the team’s overall efficiency. To calculate it, you should divide the number of issues closed and tasks completed during the iteration, by the number of issues and tasks opened during the same period. The metric is highly valuable in dynamics: if the rate is growing, your team is increasing its efficiency, and once in a case of a drop, you need to investigate the cause of the performance hit.
- Team velocity. The performance of Agile teams is measured in Story Points or other arbitrary units. Such units make it possible to compare completely different tasks prepared by different roles when each task has a certain “price” measured in SP. This approach allows Agile teams to make more accurate estimates and set realistic plans.
- Lead time. This metric measures the time from the initial request to the completion of a task. Lead time helps step into the efficiency of the team’s processes and how quickly they can deliver the results of their work. A decrease in lead time indicates that the team is becoming more efficient, while an increase in lead time may signal that there are issues with the team’s processes that need to be addressed.
- Cycle time. A part of the lead time required for development, testing, and delivery is called cycle time. Cycle time provides insight into how efficiently the team can complete tasks and how quickly they can deliver them. Once a team is practicing continuous delivery, their cycle time is often measured in minutes not days.
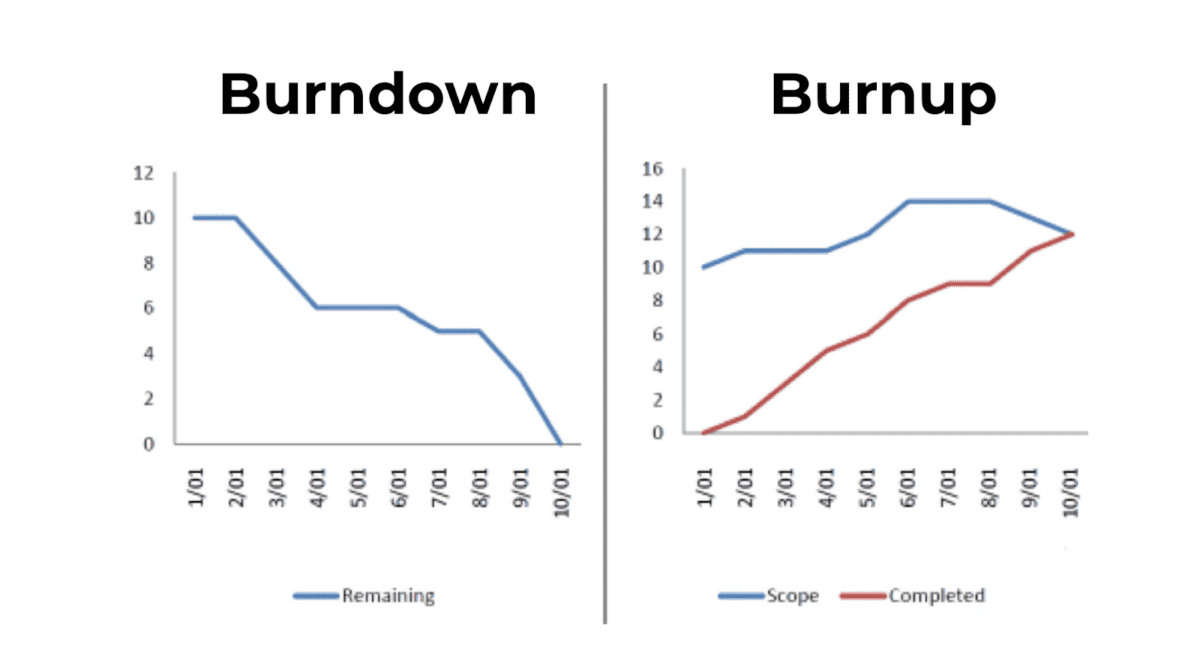
- Agile burnup and burndown. Both burnup and burndown metrics are used by Agile (most often Scrum) teams to track how their actual performance correlates with plans. The first one shows completed tasks compared with the overall scope planned. The second is the opposite and focused on the amount of work remaining in a sprint and corresponds to the amount of time remaining.
Both charts help the team to stay on track and ensure that they are on course to complete all the work within the allocated sprint timeframe. Despite these two metrics looking like mirrored twins, the burndown chart is better for projects with fixed scope, while any scope increases are indistinguishable from performance drops. The burnup chart focuses on completed tasks and lacks this drawback.
Performance Metrics
Both overall development team performance and the personal performance of each team member are surely crucial assessments for software development management. Once the performance is non-linear, there are several metrics for tracking it from different angles.
- Developer performance metrics include a number of issues completed within a certain time; issue cycle time (quite close to Agile cycle time, meaning the average time required for creating and completing a single issue); a number of pull requests merged; code review time (the average time required for opening and merging a pull request).
- Cumulative performance metrics include previously mentioned lead and cycle time but average for all the team; throughput (the amount of work completed by the team over a certain period); burnup and burndown charts; customer satisfaction rate.
Security Metrics
Often overlooked until it’s too late, security metrics are not less important than performance ones.
- Endpoint incidents illustrate the number of endpoints (devices and platforms operated by end-users where the software product is launched) that are faced any issues like malware infection, bugs, or compatibility flaws. The fewer endpoint incidents detected, the more your software is stable and reliable.
- Mean time between failures (MTBF) is the average time your software works without any kinds of failures. MTBF measures a system’s stability: a longer time means more stable software.
- Mean time to repair (MTTR) shows the average time required to fix an issue, acting as a system’s maintainability controlling value.
- Application crash rate is another security metric, calculated by dividing the number of software crashes by the number of its usage episodes within the same period of time. If a system is of perfect quality, the application crash rate should tend to zero, while the higher values show much lower quality.
Test Metrics
This group of metrics covers different aspects of quality and its assurance. Below are the most popular of them.
- Test coverage shows a percentage of the source code covered with tests. The higher this rate, the better quality. However, it’s almost impossible to cover 100% of the source code with tests.
- Automated tests percentage is quite similar to the previous metric but illustrates the share of the code covered with autotests.
- Code coverage is a metric showing the percentage of source code covered with unit tests.
- Defect distribution is a way to learn which parts of your software are the most flawed and require an additional QA effort or workflow revision, depending on the real cause of these flaws.
- Test execution is a group of close metrics including the number of tests conducted, as well as shares of tests labeled as passed, failed, incomplete, blocked, and unexecuted.
- Regression metrics like defect injection rate and defects per release or version are aimed at showing how badly the quality of code degrades with implementing changes.
Formal Metrics
The last group of metrics is here just in order to make you aware of what metrics you shouldn’t use due to their uselessness. Such metrics are usually used by less experienced software development teams with immature processes.
- Lines of code are not just useless but harmful metric. If a company asks their developers how many lines of code they’ve written, and pays them correspondingly, this is a strong motivator for developers to produce tons of redundant code in order to increase the number of lines.
- Number of tasks completed. As opposed to the velocity, the number of completed tasks tells us nothing about the real performance. The developer can complete dozens of minuscule worthless tasks each hour, or work hard the whole day to complete a single one that is really challenging and valuable.
- Number of bugs fixed apart from their work capacity is a metric similar to the previous one in terms of its uselessness.
- Hours worked means the same old soup just reheated. Your developers can spend all their time at work drinking coffee and playing video games, receiving a maximum salary in exchange for their useless overtime. Do you want this to happen to you? Highly unlikely.

Acceptable Values for Software Development Metrics
However, here are some reasonable starting points for the metrics we’ve mentioned above.
- Open/Close rate. Aim for a close rate of 75% or higher. This means that at least 75% of all issues raised should be closed in a given period. A lower percentage could mean that your team has insufficient efficiency or that your plans for the iteration aren’t realistic and feasible. A higher percentage means you can plan more activities per period.
- Team velocity. This will vary greatly depending on the team size, and experience, but mainly on the particular “price” you’ve set for your Story Point, so there’s no way to set a universal KPI for this metric.
- Lead time. The desired lead time should be about 3–5 days from when a feature is requested to when it’s implemented. If the lead time is higher, this means your staff is underperforming or the task wasn’t decomposed enough.
- Agile burnup and burndown. This metric hasn’t any desired values but you should strive for a consistent, steady rate of progress, with the burnup and burndown charts converging at the end of each iteration.
- Developer performance metrics. Focus on individual metrics like:
– code review turnaround time (aim for one business day or less),
– code quality (less than 5% defect rate),
– feature completion rate (at least 90% of assigned tasks completed).
- Cumulative performance metrics. Apart from the previous case, here you should focus on team-level metrics:
– sprint completion rate (aim for 90–95%),
– code quality (maintain less than a 5% defect rate).
- Endpoint incidents. A common practice is to aim at less than 1% of total requests resulting in incidents.
- MTBF. Strive for the mean time between failures of at least 500 hours, with a goal of continuous improvement of this metric.
- MTTR. For the “Mean time to repair” metric, a good practice is to keep the value under 4 hours for critical issues and under 24 hours for non-critical ones.
- Application crash rate. Target a crash rate of less than 0.5% of sessions.
- Test coverage. According to Atlassian, a good goal here is to strive for a test coverage rate of 80%.
- Automated tests percentage. Once some authors claim that the 100% coverage of autotests can and should be achieved, the more realistic KPI for this metric is 75–85%.
- Code coverage. To be considered sufficient, your code coverage rate must be at least 70–80%.
- Defect distribution. Aim for a balanced distribution of defects across modules, with no module having more than 25% of the total defects.
- Test execution. Strive for a test execution pass rate of 90–95%.
- Regression. Target a regression rate of less than 5% for every new release.
Remember that these values are only starting points and should be tailored to your specific situation. Moreover, most of the metrics above must be considered in dynamic to become really helpful. Regularly review and adjust your performance tracking and management strategy based on your team’s performance and the unique requirements of your project.
How to Choose KPI Metrics to Achieve Success
Choosing the Optimal Number of KPIs
First of all, remember that KPIs are always “key”. This means you should always focus on a limited number of KPIs that are most relevant and closely aligned with the project’s strategic goals. Don’t think the more different metrics you’ll control within your software development process, the better.
A good rule of thumb is to track between 1 and 3 KPIs for a software development project. Such a number of KPIs allow you and your team to keep the focus on project objectives. At the same time, a properly selected pool of KPIs provides a comprehensive understanding of the project’s progress and performance.
Also, it would make sense to track 10–15 less important metrics as well. It will give you a complete understanding of the project’s health and progress. It will highlight certain aspects which could be improved and will reduce potential issues.
Below are some common principles which will help you choose KPIs that will be measurable, illustrative, and helpful.
Tips on How to Choose KPIs and Succeed
- Always remember about business goals. When setting any new metric to track, you should first analyze how it’s traced to the overall goals of the business.
- Understand and consider both team and project contexts. Both metrics and KPIs mentioned above are always highly dependent on the project context you must take into consideration. For example, for typical software development projects, the lead time of 3–5 days is fully ok but if we speak about special projects with hardly decomposing tasks, this could be not enough.
- Focus on outcomes. This means don’t use formal metrics which are easiest to track instead of tracking those which are really outcome-oriented.
- Track a manageable number of metrics. Define 1–3 KPIs and 10–15 other metrics. Otherwise, your focus will be spread too thin.
- Adhere to the S.M.A.R.T. concept. Yes, this mnemonic abbreviation is aimed at goals and objectives, meaning “specific, measurable, assignable, realistic, and time-related”. And all these requirements can and should be applied to the metrics you’re planning to track.
Following these pieces of advice, you can choose the right KPIs for your software development team, ensuring that you are on track to achieve success and drive continuous improvement.
We hope you’ve found this article helpful. In case you have any questions, feel free to ask us.
Remote tech teams & the future of work blog
Remote tech teams & the future of work blog
Your form has been successfully submitted.